
In my earlier post, I set out some of the headlines from the BRES 2021 data and here I want to delve a little deeper to look at where jobs are being created. I have created dashboard here that shows the data and allows you to generate your own analyses.
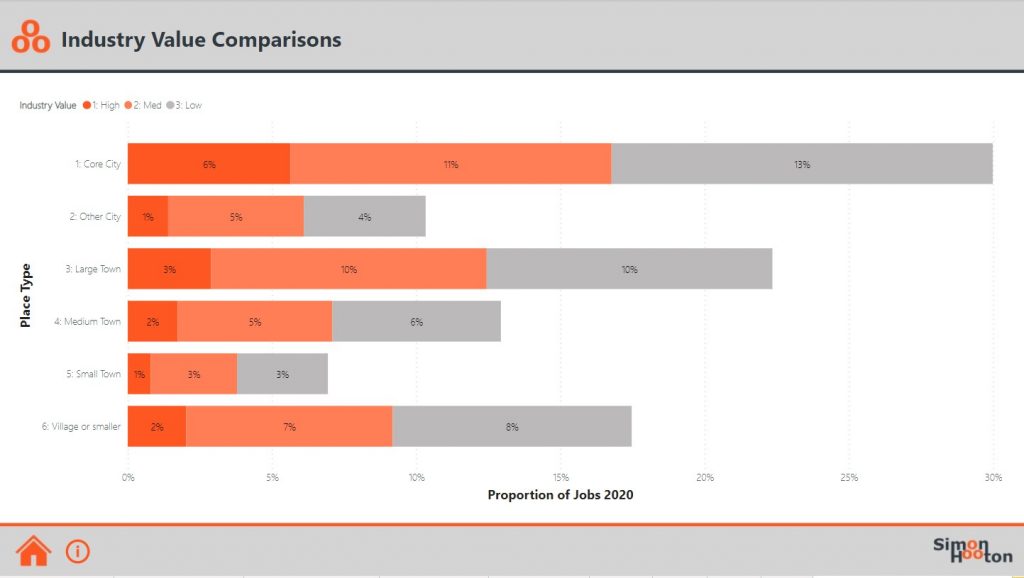
I have grouped sectors by value (using outputs per hour worked) and local authorities by Place Type using a House of Commons framework[1]. From this we can see broadly where in 2020 jobs were located:
| Place Type | Proportion of GB Employment 2020 |
|---|---|
| Core Cities | 30% |
| Other Cities | 10% |
| Large towns | 23% |
| Medium Towns | 13% |
| Small Towns | 7% |
| Village or Smaller | 17% |
We can also see how the shape of employment differs between places. Core Cities (20%) accommodate more Higher Value sector employment (20% of their total employment) than Large Towns (13%) and Villages (12%). And on the flip side, more sparsely populated places tend to have a higher level of lower value employment than more urban areas, however over 40% of employment in both Villages and Core Cities is in lower value sectors.
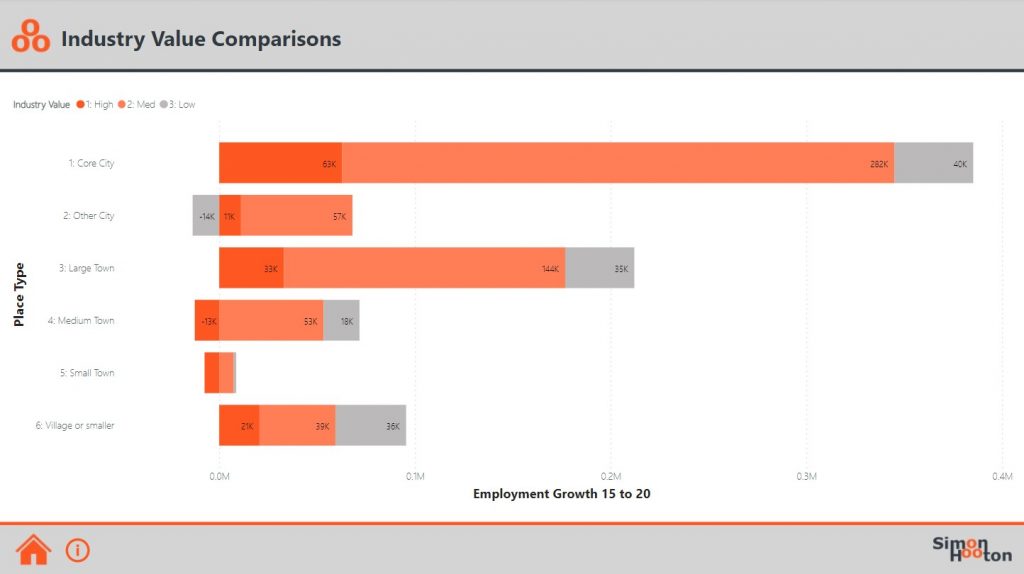
Nearly half (47%) the net growth in employment over the five-year period occurred in Core Cities (385k) and most of that growth has been in mid-value sectors (282k). Medium and Small Towns actually saw a reduction in higher value employment in that period and Small Towns only saw a very modest overall growth in employment. This will be, at least partly, explained by people living in the smaller towns taking up jobs in nearby by cities and large towns.
Employment Growth & Specialisation
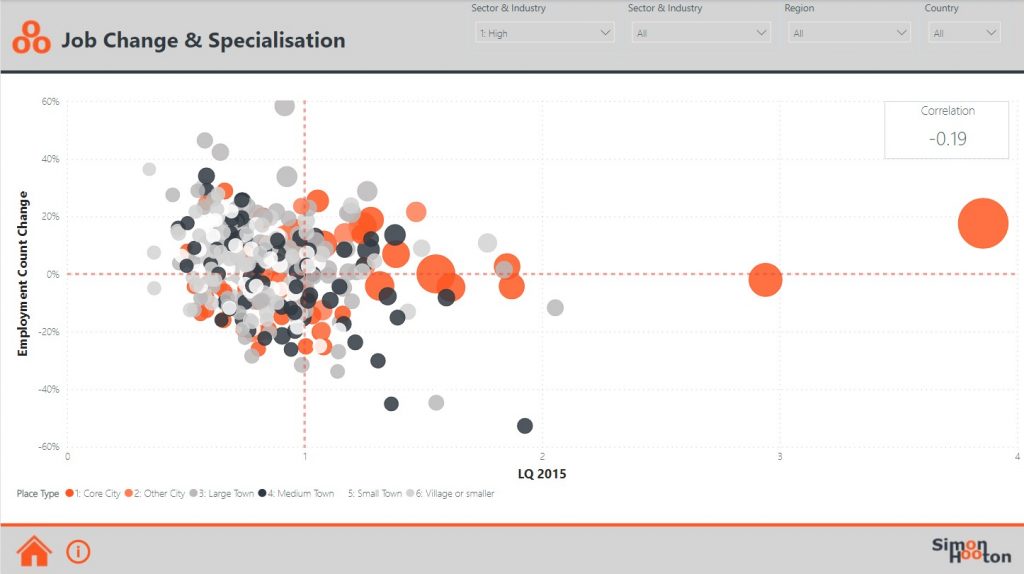
I have also used the BRES data to calculate specialisation scores (also known as Location Quotients or LQs). These allow us to see for any area how highly specialised any one sector of the economy is.
It has been a long-running cornerstone of economic development that places should try to concentrate on building on those sectors where they already have a distinctive strength. This is the core of cluster/agglomeration thinking but also makes intuitive sense – it is generally easier to build on something than try to create a base of activity from scratch, especially when competing against places already have a head start in terms of businesses, assets, and skilled people in their area.
The dashboard allows you to look at all sectors individually, but here I’ve just concentrated on higher value sectors as these are the types of sectors that have been most closely associated with clustering policy. I have plotted percentage job growth vs LQ in 2015 to see if places that a degree of specialisation had grown more than those that did not. The answer is No: the correlation across local authority data for 2015-20 shows a weak and negative relationship (-0.19). Broadly similar relationships are seen with Medium and Lower value sectors too.
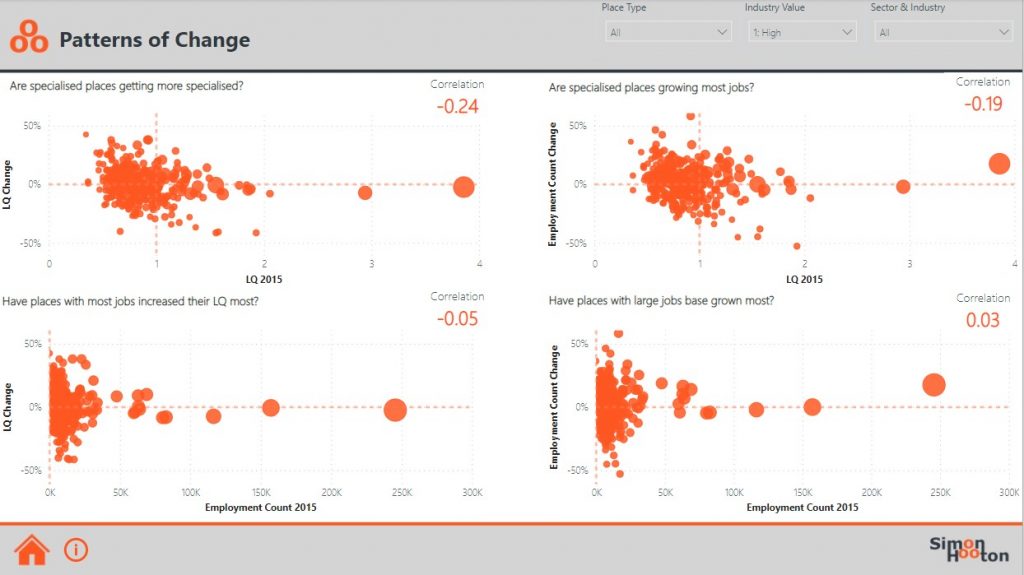
To further test the concept, I looked at other possibly hypotheses:
- Are specialised places getting more specialised?
- Have places with most jobs increased their LQ most?
- Have places with a large jobs base grown most?
In all cases, for Higher Value sectors, the answer is generally (as shown below), No.
So what does this tell us?
Although cities have been the engine room of employment growth, agglomeration thinking might fall down when it is applied to clusters or sectors. But before we abandon the idea entirely, we probably need a longer a time series; five years is not long enough to reflect the impact of any cluster interventions, the UK’s investment in cluster growth has been limited during this time and the period covers two one-off events (Brexit and Covid).
It may also mean that our understanding of sectors and our ability to look closely at parts of the economy needs a new approach. We know that the SIC codes (upon which all this analysis is based) do not reflect the emergent economy. At Hatch/Regeneris we worked with Glassai and Data City to develop more appropriate frameworks for mapping businesses and sectors. We had some success, but these approaches are not yet recognised in the official data and so cannot be readily used for these sorts of analysis.
It is also clear that our understanding of place doesn’t reflect evolving commuting/working patterns which mean more people live and work in different types of place. Cities rely on neighbouring towns and villages for employees and any analysis of this nature needs to reflect the interdependencies between places.
There is also something in here for me about the core economy vs the specialised economy. Every economy needs a base level of activity in some sectors eg retail, education, health. A base of these sectors should be distributed evenly across the country albeit with some specialisation in university towns or places with a large public sector employer. And, then there are specialised sectors which serve markets beyond local borders, and where one would expect to see a much broader spread of specialisation scores across the country.
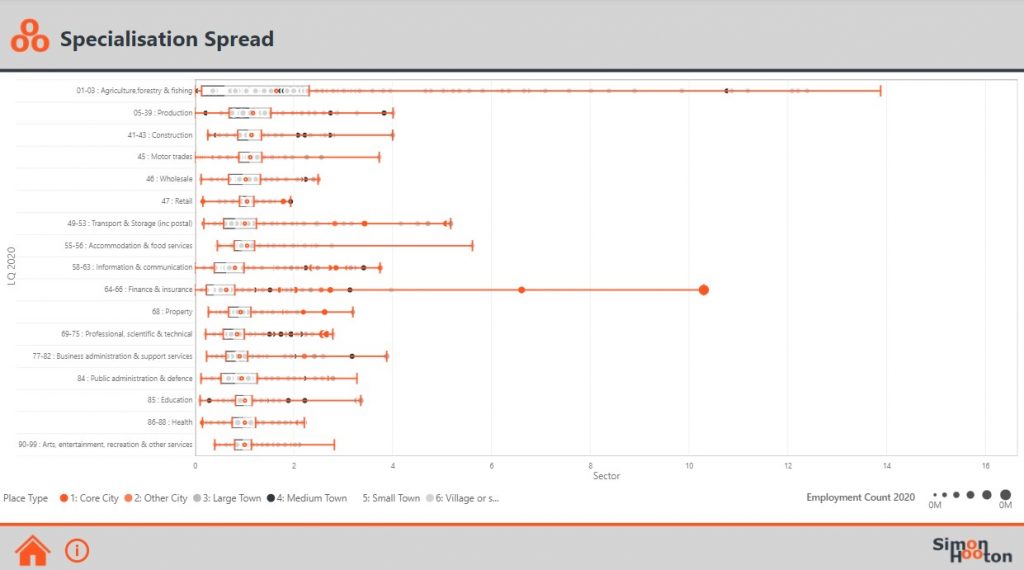
As you can see below, the dashboard allows us to look at this and see that it may be possible to group sectors into three groups:
- Base Sectors: which have apparent limits to their specialisation potential ie Retail (max LQ 1.94), Wholesale (max LQ 2.49), Health (max LQ 2.22), Accommodation & Food Services (max LQ 2.77), Education (max LQ 2.23) and Arts, Entertainment, Recreation (max LQ 2.10).[2]
- High Specialisation Potential: sectors where there is scope to secure high specialisation LQs ie >4. This would include Agriculture (max LQ = 13.88, Angus), Finance (max LQ = 10.3, City of London), Production (max LQ = 4.01, Copeland), and Transport (max LQ = 5.18, Crawley)
- Intermediate Specialisation Potential: other sectorshave some specialisation potential but are distributed broadly across the country ie Construction, Motor Trades, Information & Communication, Professional, Scientific & Technical and Business Administration.
Clearly these are broad sectors and within each of them there is scope for places to establish narrower sub-sector specialisations (although this places limits on the actual scale of employment that might be created).
If we had a better way of categorising economic activity, I would expect to see new emergent groupings of businesses working in sectors such as data analytics, cyber, med-tech etc. A new approach to categorising businesses would let us to track trends nationally and allow us to see which places are establishing a strength in these important sectors that will drive a lot of the growth in the UK.
[1] Note: the Pace Type is applied to whole local authorities so is a Summary classification which may not fully reflect every part of the district. Examples are set out below
| Place Type | Selection of Included Local Authorities: |
|---|---|
| Core Cities | Cardiff, Edinburgh, Glasgow, Leeds, Liverpool, Manchester, Newcastle, Nottingham and Sheffield |
| Other Cities | Coventry, Derby, Hull, Leicester, Luton, Middlesbrough, Milton Keynes, Northampton, Norwich, Plymouth, Portsmouth, Reading, Southampton, Southend, Stoke-on-Trent, Sunderland, Swansea, Swindon and Wolverhampton |
| Large towns | Basildon, Burnley, Cambridge, Cheltenham, Dundee City, Exeter, Hartlepool, Ipswich, Oxford, Peterborough, Preston, Rotherham, St Albans, Thurrock, Warrington, Watford and Wrexham |
| Medium Towns | Barrow-in-Furness, Canterbury, Chorley, Dover, Dudley, Great Yarmouth, Kettering, Lancaster, Lichfield, Merthyr Tydfil, Redcar and Cleveland, Tunbridge Wells, Walsall, Wellingborough and Wokingham |
| Small Towns | Bolsover, Bridgend, Conwy, East Dorset, Epping Forest, Isle of Wight, North East Derbyshire, Pendle, Rochford, Rossendale, South Bucks, South Staffordshire, Tewkesbury, Wakefield and Wigan |
| Village or Smaller | County of Herefordshire, County Durham, Shropshire, Cornwall, Wiltshire, Central Bedfordshire, Northumberland, Winchester, Ribble Valley, Newark and Sherwood, Mid Suffolk, Malvern Hills, Dorset, Allerdale, Aberdeenshire, Pembrokeshire, Derbyshire Dales |
[2] These figures exclude Isles of Scilly from Accommodation ad Staffordshire Moorland (Alton Towers) from Art Entertainment as they are outliers with skew position of the overall sector. And exclude the outliers of Oxford & Cambridge from Education which are huge universities that account for a very large amount of local employment and whose position cannot be emulated by others.
No responses yet