
In November 2021, the latest Business Register and Employment Survey (BRES) was published. This allows us to look at employee numbers across GB local authorities and sectors (2 digit) for five years between 2015 and 2020.
In my time at Hatch and Regeneris I really enjoyed developing my data skills and learning how to use PowerBI which I think is a great tool for sharing interactive analysis drawing together data from different sources to help understand trends in economic development.
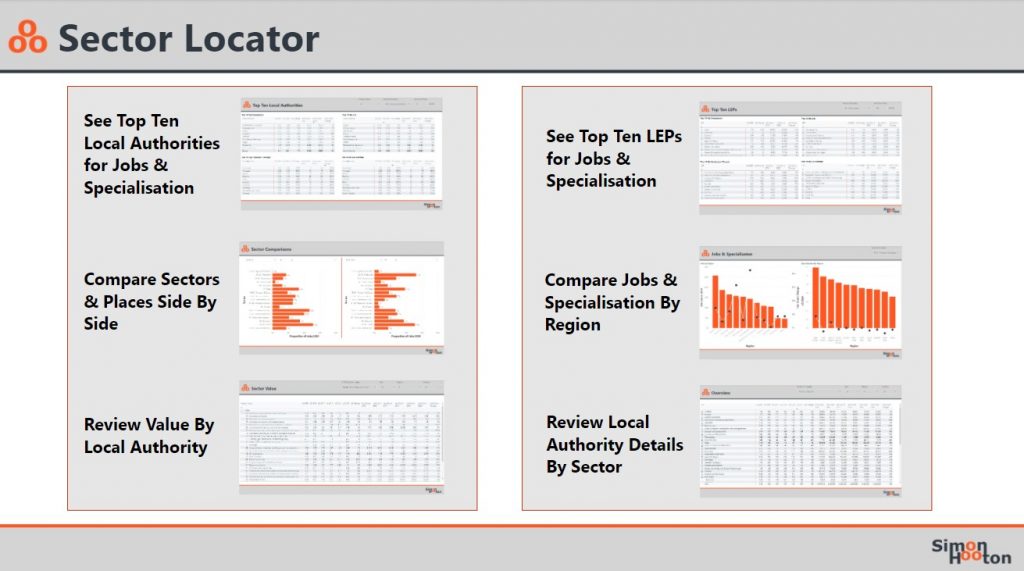
In my Covid enforced isolation, I built a dashboard that helps analyse the changes in employee numbers each year so we can see which places and sectors have fared best/least well. I have also used the data to identify sector specialisation (or location quotients) to help see which places have strengths in which business sectors. I have also tagged the sectors by Industry Value (reflecting employee output per hour) and grouped local authorities by Place Type (explanations are on the notes page of the dashboard which is here for everyone to use. My quick takeaway headlines are below.
COVID Effects on Employment: BRES Changes 2019 -2020
ONS reported that Great Britain had 571k[1] fewer employees in September 2020 than it did a year earlier. The biggest drop has been seen in low value sectors (530k); high value sectors fell (74k), while medium value sectors grew (35k).
The biggest fall was seen in Accommodation, Food and Beverage sector (174k), followed Arts, Entertainment and Recreation (125k), which have been regularly highlighted as being vulnerable to Covid lockdowns. But, there were also significant drops in Production (73k), Professional Scientific (73k) and Business Administration roles (64k) too.
On the other hand, some sectors grew, principally Health (67k) although this masks a 150k growth in Human Health Activities (presumably pandemic response recruitment) and an 82k fall in Social Work, Without Accommodation, (presumably home help care for people isolating). Transport & Storage also grew (22k) but this masks a 30k growth in Warehousing work and a 20k drop in Postal/Courier Activities, which seems odd given the number of people who’ve been dropping parcels in my street for the last 18 months.
Some sectors were almost unchanged such as Property (1%) and Information and Communication (0%). Within the Information & Communication sector though there was some significant churn; employment dropped in Publishing and Telecommunications, but grew in Films, Video & TV and Computer Programming. More evidence of the shift our lives have taken during isolation at home.
By local authority, the biggest fall in 2019-20 occurred in Westminster (35k) driven by Accommodation & Food (15k), Business Administration (10k) and Arts/Entertainment (10k). Next was Camden (14k), also driven by the same sectors. Six of the ten biggest drops were in London Boroughs. Leeds, Aberdeen, Sheffield and Newcastle make up the rest of the top 10. Although LB Newham and City of London feature in the top 10 local authorities that grew, driven by Public Administration (4k) and Business Administration (5k) respectively. The biggest overall growth between 2019 & 2020 was seen in Cambridge (14k), largely driven by a one-off jump in its Education sector (11k); I am not sure what lies behind this, it could be Covid-related or a major start-up/relocation/re-classification that crop up over time.
Although the latest data confirms many of the things we were expecting, it isn’t going to tell us with any great reliability what the fuller effects of Covid have been on employment; that will have to wait until we get back to some degree of normality. The next release later in 2022 will cover the period of the furlough and its winding down, so will be volatile too.
Longer Range Change (2015 -2020)
The data allows us to look more reliably at longer term changes in the composition and location of employment across Great Britain’s sectors and local authorities.
Over the five-year period overall employee numbers grew (807k[2]) with medium value sectors really driving the growth (580k); high and low value sectors clocked up growth of 107k and 117k respectively.
Nearly half the net employment growth (385k) has occurred in Core Cities, followed by Large Towns (212k). All Place Types grew apart from Small Towns which remained pretty static over the five-year period. This underscores some of the messaging around the Levelling Up Agenda and supports the wider trend of economic growth concentrating in more urban areas. That said, villages secured a respectable 95k job growth; this is not a pandemic reaction as the latest year shows a fall for villages.
In the five year period, Health has been the single largest growth sector (202k), followed by Transport & Storage (170k) and Professional, Scientific & Technical (151k). The biggest job contraction has been seen in Retail (83k), followed, surprisingly by Arts, Entertainment & Recreation sector (78k), although this fall all occurred in the 2019-20 period and can probably be attributed to COVID. Production (ie manufacturing jobs) rose in the early part of the 5-year period but has fallen back since 2018 which could perhaps be attributed to Brexit referendum result.
By some distance the City of London has seen the biggest jump in job numbers (90k), followed by Manchester (56k), Dacorum (32k), Solihull (32k) and Edinburgh (29k). Hackney is the only other London Borough in the Top 10. At the end of the scale, the list of places that lost most jobs is headed by Aberdeen (23k), Nottingham (22k), Watford (19k), Sandwell (13k) and Tunbridge Wells (12k). The big drop in Aberdeen has been in Mining Support Services (6k) and Architectural Engineering (3k), no doubt connected to the oil & gas sector. Nottingham and Watford have lost a huge number of Business Administration jobs (34k and 18k respectively).
Sector Specialisation
I plan to do another post on the patterns around sector specialisation but thought it worth setting out headlines. The dashboard shows specialisation scores aka location quotient (LQ) for all local authorities and sectors for each year and shows the changes over time too.
Ipswich records the highest single specialisation score for any sector – the Manufacture of Tobacco Products, but it only accounts for 20 jobs which is pretty much the entirely of what is left of the UK base. This illustrates one of the points to be wary of when looking at specialisation scores (or LQs); some places can secure high scores with a small base in a niche sector, especially if they are located in relatively small authorities.
Not surprisingly, the City of London has Great Britain’s highest specialisation score for Finance & Insurance (10.3 with 190k employees). As befits a places that has its own breed of cattle, Angus in Scotland also has the highest specialisation score for Agriculture, Forestry & Fishing (LQ of 13.9 and 4k employees). Copeland (4.01, 11k employees) and Barrow (3.83, 11k employees) head up the UK’s Production jobs specialisation (nuclear supply chain and submarines).
Crawley has GB’s greatest specialisation in Transport & Storage (5.18, 24k employees, many related to Gatwick), South Ribble heads the league table for Construction (4.00, 11k employees – Im not sure why, suggestions welcome), North Warwickshire leads for Motor Trade (3.73, 3k employees, which I expect is due to JLR), and the Isles of Scilly for Accommodation & Food Services (5.62 on account of there being little other work on offer locally; it is just 425 employees that sit behind that score). The M4 corridor leads the Information Communication Specialisation rank (Reading 3.75, West Berkshire 3.42, Wokingham 3.43 and Bracknell Forest 3.22, with a combined total of 53k employees working locally). South Cambridgeshire leads on Professional Scientific (2.79, 20k employees; due in large part to the local life sciences sector, no doubt), Dacorum (3.88, 33k employees) leads on Business Administration (again, I’m not sure if this is some large employers or a broader spread of businesses in what is quite a diffuse sector). Bridgend (3.28, 8k employees; any idea why?), Blackpool (2.79, 8k; DWP/MoD) and Swansea (2.69, 13k; DVLA) lead on Public Administration while Oxford & Cambridge universities put their local authorities at the head of the Education specialisation rankings (3.36 and 3.28 with 36k employees a piece). And, Staffordshire Moorland heads up the Arts, Entertainment sector ranking (2.82, 3.5k employees; on account of Alton Towers).
I guess this shows having a high LQ is often the sign of a major employer in local area and not necessarily a reflection of a thriving sub-sector and supply chain. In my next post I plan to use this data to look at the patterns of growth in more specialised economies.
[1] Rounding of local authority level data means the total change reported in the dashboard is 567k
[2] The reported total for GB is 769k. The difference is I believe due to rounding and reporting across local authorities and sectors that has been used in the dashboard.
One response
[…] Who Works Where: Employment & Specialisation in Great Britain in 2021 […]